CanPL Roster Turnover
The fan communities surrounding the Canadian Premier League (CanPL) and its teams are starting to rumble again as offseason player movements are starting to happen again. A common thing I've read is that people think the number of players that leave teams in the offseason is absurdly high. The feeling seems to be that a CanPL roster should be quite stable from year-to-year.
I think this is something that we North American fans have become comfortable with while observing traditional North American leagues; the NHL, NBA, NFL, CFL, MLS, etc. As fans of those leagues we've become comfortable with minor tweaking with the aim of dynasty building. Seeing a professional team release or not re-sign a large portion of the playing squad makes us uncomfortable.
Thinking about all of this, I started to ask myself a few questions. First, have the CanPL teams released a higher number of players between seasons than teams in similar leagues? Second, how do the number of minutes played and goals scored of the players released by CanPL teams compare to teams in similar leagues? And finally, is there any correlation between the attributes of roster changes (number of players changed, minutes played, goals scored, etc) and the results the team achieves in the subsequent season?
Data and constraints
The first thing that is needed to answer these questions is a league that is similar to the CanPL. For the purposes of this exercise, the similar league I chose was the National League, step 5 in the English football pyramid. Why the National League? Arguably it is close to the same level of football as the CanPL. Some might argue League 2 (step 4 of the pyramid) is a similar level, and it might be. We have no concrete way of measuring either comparison, so the selection of the National League is somewhat arbitrary.
One could argue that the USL Championship (USL-C) is a comparible league that should be used. As I pointed out earlier, North American sports operate in a different way than most football leagues in the rest of the world. To avoid the risk of comparing the CanPL to North American league behaviours would have tainted the results. There might well be a reason to compare roster turnover between CanPL and USL-C, but none of the questions I proposed need that specific comparison to be done.
To gather the National League data I employed the league and team summary pages at fbref.com. I went through every team in the seasons from 2006-2007 to 2019-2020. The 20/21 season was excluded because it is only partially completed. The data available on the website excludes cup matches.
For the CanPL, the only complete data available is from the roster changes between the 2019 and 2020 seasons. The data for this was gathered from the Centre Circle Data made available by the CanPL itself. Because Atlético Ottawa didn't participate in the 2019 season they have been excluded from the dataset.
The 2020 season (The Island Games) were significantly affected by COVID-19 restrictions. Many teams in the CanPL weren't able to get all of their foreign players into Canada to join the squads in Charlottetown. Almost all of those missing players were new additions to their respective squads. The only player that I'm aware of that wasn't able to return to a squad because of COVID restrictions was José Escalante of Cavalry. I have adjusted for this by including him as a squad member in 2020 as he was intended to be.
A difference between the National League and CanPL is the possible roster size. Because of that, comparisons between the two leagues on raw counts will be skewed. To normalize the data for an equal comparison the following data will be used.
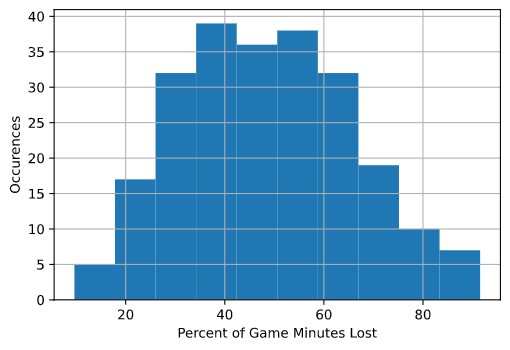
- Percent of Game Minutes Lost = Total minutes played by departing players / Games played by the team * 90 minutes
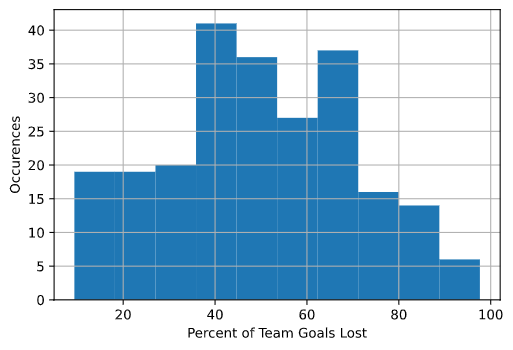
- Percent of Team Goals Lost = Total goals scored by departing players / Total goals scored by entire squad * 100
- Percent of Squad Departing = Number of departing players / Number of players listed for the squad * 100
Because the National League has both promotion and relegation I only compared roster changes when a team played two consecutive seasons in the National League. Promotion and/or relegation increase the likelihood that a team would significantly alter their roster as they adjust to their new league. It was easier not to try to adjust for those types of changes to a team.
Finally, the player departures are not based on the final squad of the season and the first squad of the next season. I didn't have that level of information available and it would have only accounted for the game-day 16. Players in the squad but injured, or simply healthy cuts would have been miscounted. Instead, if a player appears on the FBRef page for the team in that season, they are counted as being part of the squad for that year. If they transfer out at any point between the first game of the season and the first game of the next season, they will be counted as a departed player. If a player transfers into a team at any point during a season they will be counted as part of the squad.
With all of these constraints imposed, I was able to extract 235 between season periods, from the National League, for use in the study.
Player departures
The original thought space that drove me down this exploration stemmed from CanPL fan statements declaring their disappointment with the number of players departing teams during the off season. Personally, I had always expected larger squad turnovers between seasons in the CanPL. But was what we were seeing abnormally large?
National League
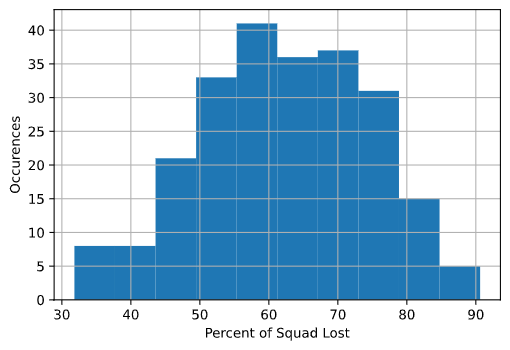
Looking at the National League data, the smallest Percent of Squad Departing was 31.8%. This was done by Histon between the 2007/2008 and 2008/2009 seasons where only 7 of the 22 players in the 07/08 roster departed. While Histon lost almost 1/3 of its players, the Percent of Game Minutes Lost was limited to 14.4% which suggests that they were able to retain core players and limited departures to the fringes of the squad. The Percent of Team Goals Lost was 15.8% which also supports the fringe player exodus theory.
Two teams share the honor of losing the highest Percent of Squad Departing at 90.6%; Wrexham and Braintree Town both between the 15/16 and 16/17 seasons. Wrexham faired slightly better with a Percent of Game Minutes lost value of 77.8% vs the 81.0% for Braintree Town. When a team loses 90%+ of their squad the game minutes will inevitably be high. The same should be expected of the Percent of Team Goals Lost, which was 83.1% for Wrexham. Braintree Town, however, bucked that trend and only had a 53.6% Percent of Team Goals Lost. While both teams clearly lost a lot of players, Braintree Town appears to have been able to hold onto a small number of players who scored a significant number of their goals.
Overall, the distribution of Percent of Squad Lost fits nicely into a histogram. This shows that, in the National League, a team should be expected to see between 50% and 80% of their squad depart each season. It's interesting to note that there were no situations where less than 30% of the squad departed, but there were a significant number of occurences where more than 70% of the squad did.
CanPL
As with all of these comparisons, the CanPL has a very limited dataset. We won't know if the 2019 to 2020 offseason was an anomoly until we get many more sample seasons to observe.
The big roster story between the 2019 and 2020 seasons was the HFX Wanderers blowing up their roster. Was the size of that roster change abnormal? Looking at the numbers, the Percentage of Squad Departing for HFX was 66.7%. Valour out did that with 73.1% of their squad departing. Those were the two highest squad turnovers in the league, but in the National League they would have fallen just slightly above the middle of the data distribution. Alarmingly high? Not really.
At the other end of the spectrum were Forge and Cavalry with 34.6% and 36% respectively. These numbers would have placed both teams right at the bottem end of the National League distribution for Percentage of Squad Departing. Having that little player turnover would have to be considered an outlier for this level of football.
When you look at the Percentage of Game Minutes Lost, HFX and Valour both, again, top the league numbers with 60.7% and 73.1% respectively. Both of those numbers are inline with the Percentage of Squad Departing suggesting that the roster makeovers were balanced from depth players to starters. Forge and Cavalry had Percentage of Game Minutes Lost that were about 10% lower than their Percentage of Squad Departing numbers which suggests that their departures were depth players not starters.
The extremes of the CanPL Percentage of Game Minutes Lost fit nicely into the National League distribution. HFX was at the upper end of the middle of the distribution while Valour was getting close to outlier territory. Cavalry and Forge both are in outlier territory again, but a bit closer to the middle of the distribution. Valour might have been a team to raise eyebrows given their numbers, but maybe more interesting is that Cavalry and Forge are firmly in the lower end of the distribution and in outlier territory.
Of all the stats, Percentage of Team Goals Lost is the most interesting for this dataset. Valour departed with 73.1% of their squad but lost 93.3% of their team goals in the process. That is a huge dent to scoring. For having the second highest Percentage of Squad Departing, the Percentage of Team Goals Lost for HFX is very close to many of the other teams at 47.6%. FC Edmonton had the lowest Percentage of Team Goals Lost at 25.9%. Considering how little squad turnover both Cavalry and Forge had, their Percentage of Team Goals Lost was disproportionately higher than their Squad Departure and Minutes Lost numbers. Cavalry lost 33.3% of their team goals and Forge lost 40.4% of theirs.
York9 had some of the most interesting nubmers in the CanPL dataset. Their Percentage of Squad Departing and Percentage of Game Minutes Lost were 56.5% and 29.7% respectively. While losing over half of their squad, York9 clearly were able to retain the players that played the most minutes for them in 2019. While they didn't lose many Game Minutes, York9 certainly lost a disproportionately large Percentage of Team Goals at 43.6%. So while York9 didn't lose many big minute players, they certainly lost the ones that could put the ball in the net.
| % Squad Lost | % Game Minutes Lost | % Team Goals Lost | |
|---|---|---|---|
| Forge | 34.615 | 24.367 | 40.426 |
| Cavalry | 36.000 | 26.272 | 33.333 |
| York9 | 56.521 | 29.686 | 43.590 |
| FC Edmonton | 41.667 | 34.325 | 25.926 |
| Pacific | 54.167 | 38.838 | 37.143 |
| HFX Wanderers | 66.667 | 60.718 | 47.619 |
| Valour | 73.077 | 73.124 | 93.333 |
Looking back at the first question I asked before starting this research:
Have the CanPL teams released a higher number of players between seasons than teams in similar leagues?
I think its safe to respond to that with "No". HFX Wanderers were the CanPL poster child for blowing up your team at the end of 2019. It turns out, they didn't even have the most player departures in the league, Valour did. And when you looked at both of those teams, neither was a clear outlier at the top end of the National League distribution charts.
If anything, we might want to consider saying that CanPL teams were outliers on the bottom end of the distribution charts. Forge, Cavalry and FC Edmonton had very low numbers compared to the National League. Maybe some of the CanPL teams haven't turned over their rosters enough.
When it comes to the second question;
How do the number of minutes played and goals scored of the players released by CanPL teams compare to teams in similar leagues?
It appears that the only outlier on the high side of the National League distributions was Valour. Losing 93.3% of their team goals would put them right at the upper edge of the National League. While not as extreme, the Percentage of Game Minutes Lost that Valour dealt with was on the upper tail of the distribution.
Cavalry and Forge pushed the lower limit of the distribution for Percentage of Game Minutes Lost. None of the teams, however, were in the lower tail of the distribution for Percentage of Team Goals Lost.
Correlation to league results
There's not enough quality data from the CanPL to look at this specifically for the league. We can, however, look at the results from the National League. Short story: there is no correlation between Percent of Team Goals Lost, Percentage of Squad Lost, or Percentage of Game Minutes Lost and either League Position or League Points.
If you've never seen a scatter plot that indicates correlation, this example (Source: Wikipedia) shows how you can see the resemblance to a linear grouping of data points. In this case the line is running top left to bottom right.

As this chart of league standings and squad turnover shows, there isn't any indication of correlation. The data is simply scattered throughout the plotting area. If the x-axis has any of Percent of Squad Lost, Percent of Team Goals Lost, or Percent of Game Minutes Lost and if the y-axis has either League Position Change or League Points Change, the scatter plot looks just like this.
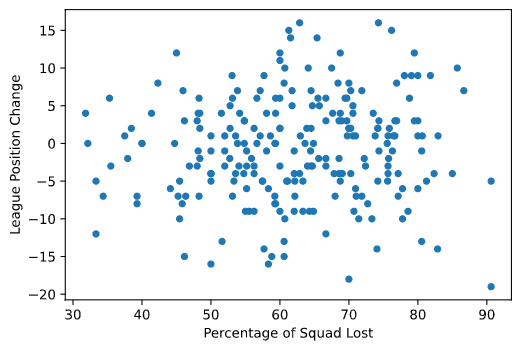
There are examples in the National League of teams losing players accounting for a large amount of the team goals and minutes played, yet finishing as high or higher in the standings in the following year. Likewise, there are a large number of examples of teams making few changes and seeing no improvement in standings. The reverse of these is also true as teams can, and have, found success when both making small and large numbers of changes.
Because of this there is no way for us to look at CanPL teams who do or don't make large changes and predict their future success or failure.
Overall
Generally, CanPL clubs were on the middle to lower end of the spectrum when looking at player departures after the 2019 season. The trend for 2020 seems to be similar as York9 are cleaning out a lot of their players this off season and other teams are moving a moderate number of players.
In the National League, 78% of teams changed between 50 and 80 percent of their roster between seasons. Assuming that the National League is a comparable league to the CanPL, we should expect to see a similar trend. Given there are eight teams at the end of 2020, that would mean that six teams would release or not re-sign between 12 and 18 players (based on a 23 player roster).
One thing that might cause the CanPL to drift from the National League numbers is the Canadian player requirements in the league. Given that there is a finite, and relatively small, number of Canadian players ready to play at the CanPL level, those players are somewhat (artificially) more valuable than their foreign counterparts. Because of this we might see less Canadian player movement as teams covet those that can play at the league's level.
I think the casual fan of the CanPL will continue to struggle with the volume of roster turnover that should be expected to happen. Most North American leagues do not change 50% or more of their roster in a single off season. When fans see this amount of change they immediately think that something is wrong behind the scenes, the organization is giving up, and that the organization is not commited to them, the fans. This may be the biggest hurdle that the CanPL has to overcome when looking to convert casual fans to rabid supporters.