The Effects of Schedule Congestion
One of the things that people have discussed endlessly about the 2019 CPL season is schedule. The league had an odd number of teams and because of that it took more weeks to get all the teams to play the same number of games. One thing we don't have many of in Canada, is weeks that are good for football. The result? A really compressed and congested schedule for all the teams. Throw the Canadian Championship and CONCACAF play into the mix and the teams were really, really, busy.
The teams played a lot of games on not very much rest through the season. A deep run in either the Canadian Championship or CONCACAF play and the congestion lasted longer. Watching the season unfold, fans wondered about the sustainability of it. How much would it affect the player's health and wellness? Would we see a rash of injuries because of it? Now, as a HFX Wanderers fan, I saw plenty of squad rotation due to injuries in 2019. Were they the result of the schedule though? I'll probably never be able to answer that as no team in their right mind is going to release their physical science data to the public.
The CPL has, however, released a trove of match and player data for the 2019 season. We can use this data to try to answer the second question that many fans asked; how is the schedule going to affect the product on the field? This is where my journey started.
How congested?
To start things off I wanted to know how congested the schedule really was in 2019. The measure I decided on was "whole days between matches". So if the team played on Saturday and then again the following Wednesday, I wanted to count Sunday, Monday and Tuesday. The thought is that these three days represent the amount of time that players had to recover and a team had to prepare for their next opponent. Is that really the case though?
We know that a Saturday-Wednesday turn around would mean 3 full days of recovery and training if the two matches were physically close to each other. For example, on Sunday Forge FC plays at home and their Wednesday match is in York. Better yet, these are two home games. But this is a geographically dispersed league and travel is not as quick as Tottenham heading to play Arsenal. So of those 3 "rest and recovery" days, there's bound to be a travel day for a team if either game is on the road.
I'm not sure how to measure the impact of that though. Team travel planning is going to vary. The Wanderers have publicly stated that they learned a lot about how not to do their travel from hard experience in 2019. So rather than trying to figure out how all the teams traveled, I decided to put them all on an equal playing field and say that their travel planning was the same and didn't add to the impact of the schedule. This probably isn't true, but I think it's better than factoring in team specific plans, getting them wrong, and influencing the outcome of the data.
Understanding all of that, here's the data.
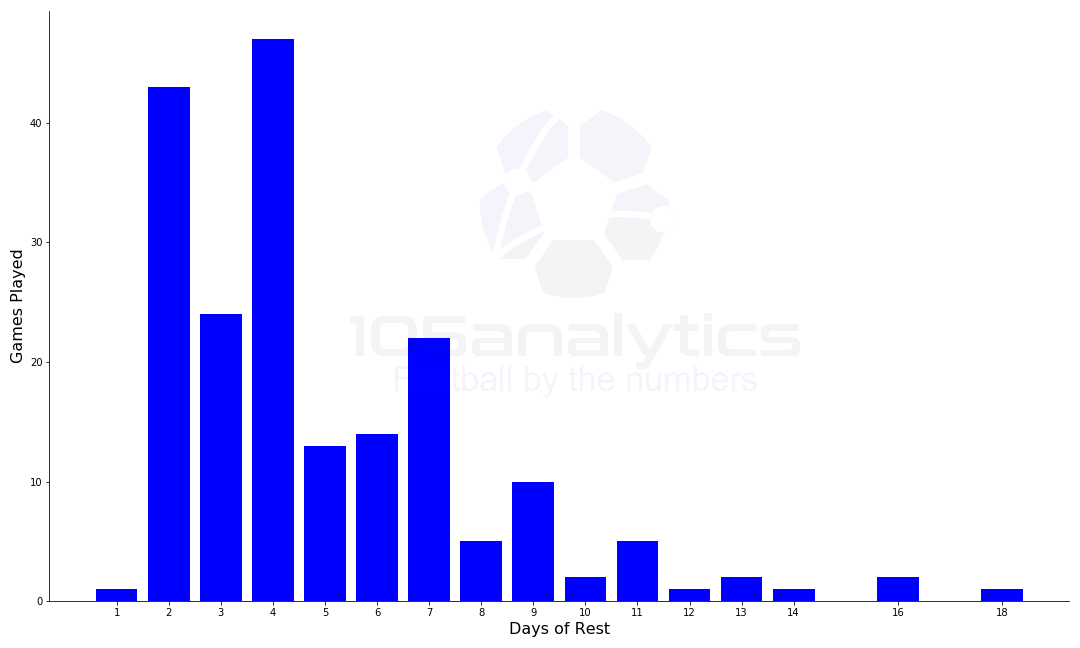
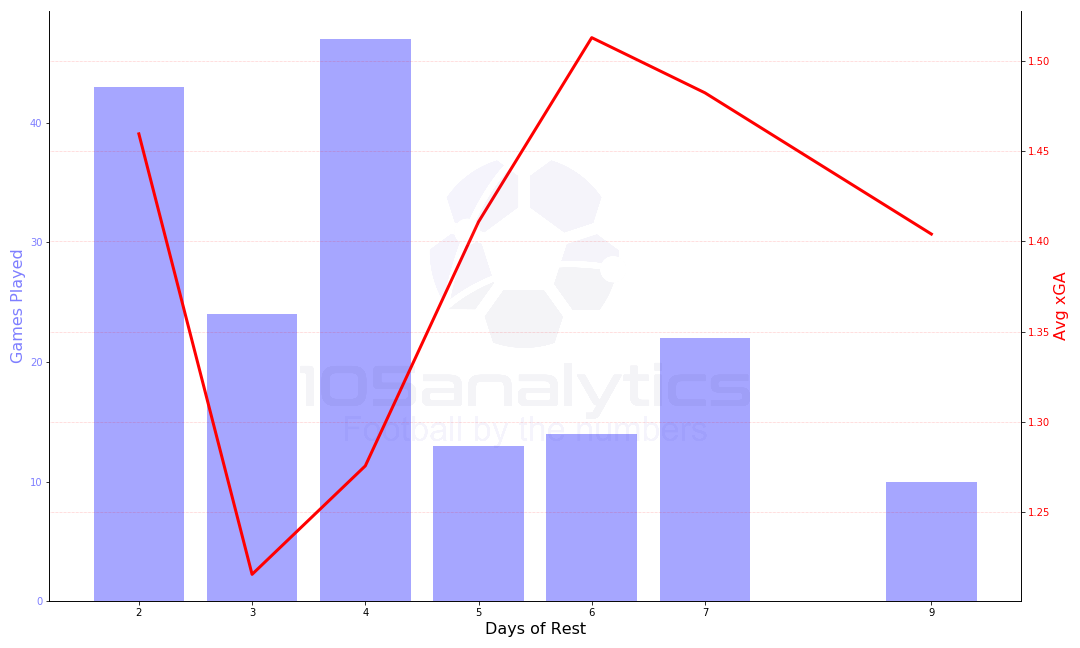
The chart shows how many games teams played after a certain number of days of rest. As you can see, there was 1 team that played a match with 1 day of rest after the previous match. Cavalry FC played the Impact on August 14th followed by FC Edmonton on August 16th. The numbers shown in that chart only account for CPL matches played. The CPL's data only includes league matches. But that doesn't represent the true reality that some of the teams faces, especially the ones that made deep runs in the Canadian Championship.
NOTE: All of the data that I talk about in this analysis is fundamentally based on the CPL games, but I have weaved in the Canadian Championship and CONCACAF matches when you see days of rest and distance travelled (more on this later).
There are a bunch of teams that played matches with 10 to 18 days of rest, but the total number of games was pretty limited. By far, the bulk of the matches were played on 2, 3, or 4 days of rest. In fact, 114 of 200 league matches (57%) were played with 2, 3, or 4 days of rest. Six days of rest would be a team playing Saturday followed by Saturday, and that only occurred 14 times in 2019. The days of rest were heavily skewed to the lower end of the chart, no question. So did this have any effect on the on-field product?
Getting up the field
A question like "How did fixture congestion affect the on-field product?" isn't easy to quantify. You have to look at things that signal poorer, or better, performance. A team's attacking performance can be a good indicator of match quality. A team that generates more chances and scores more goals, generally has a better on-field product. The data provided by the league has a few stats in it that can be used to look at attacking prowess. Expected goals (xG), goals scored and the number of points in the standings that a team acquires fit this category of metric.
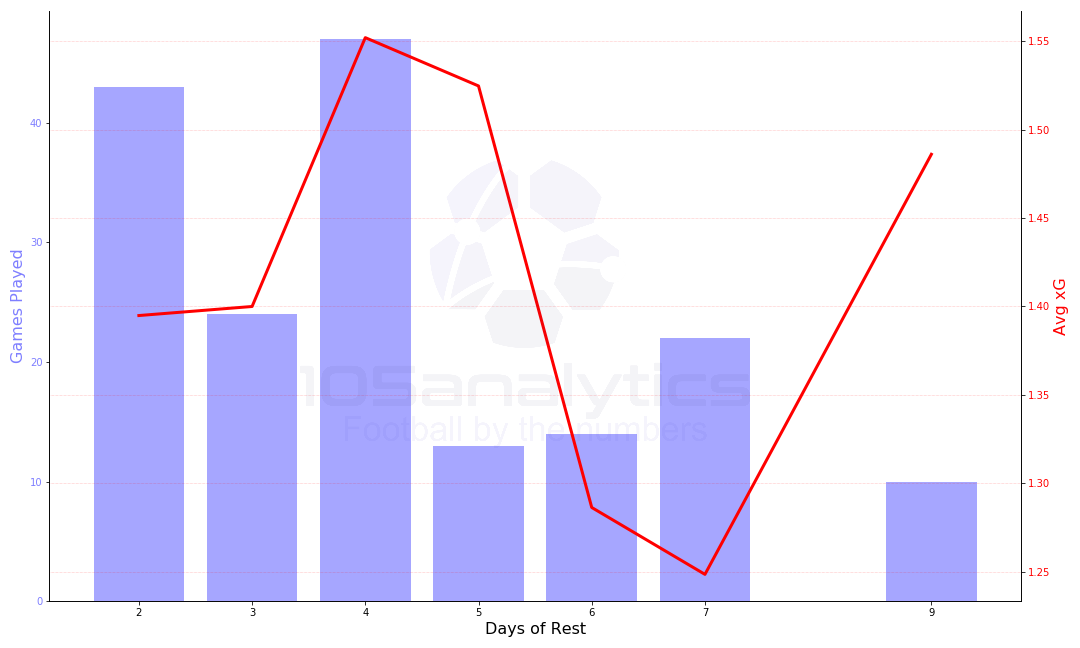
Plotting the league-wide xG data over the days of rest let's us see if there is a correlation between the two. I'll be honest, this was the first chart that I wanted to see when I started generating them. I expected to receive clear insight here. Fatigue should play a big part in the matches and, as a result, the xG value should drop. Teams should be getting fewer chances, and lower quality ones too, during these matches. I was not expecting what I saw here.
NOTE: From this point on, all of the charts will only show days of rest values that had more than 5 occurrences. You can see that the single instance of a 1 rest day match and all the high rest periods are missing. In total 20 games (about 10%) were removed from the chart because of this threshold.
The xG values when a team had 6 or 7 days of rest prior to playing are the lowest on the chart. What the hell? Teams with more rest performed worse offensively? This isn't a small sample set either. It represents 18% of the matches played.
Apparently the sweet spot for teams was a 4 day rest (play on Saturday followed by Thursday) which is when most of the league games took place. Having a rest of 2 or 3 days is, surprisingly to me, right in the middle of offensive output.
Maybe teams were getting an accumulation of chances but weren't converting them and the games really were of poor quality. Enter goals scored.
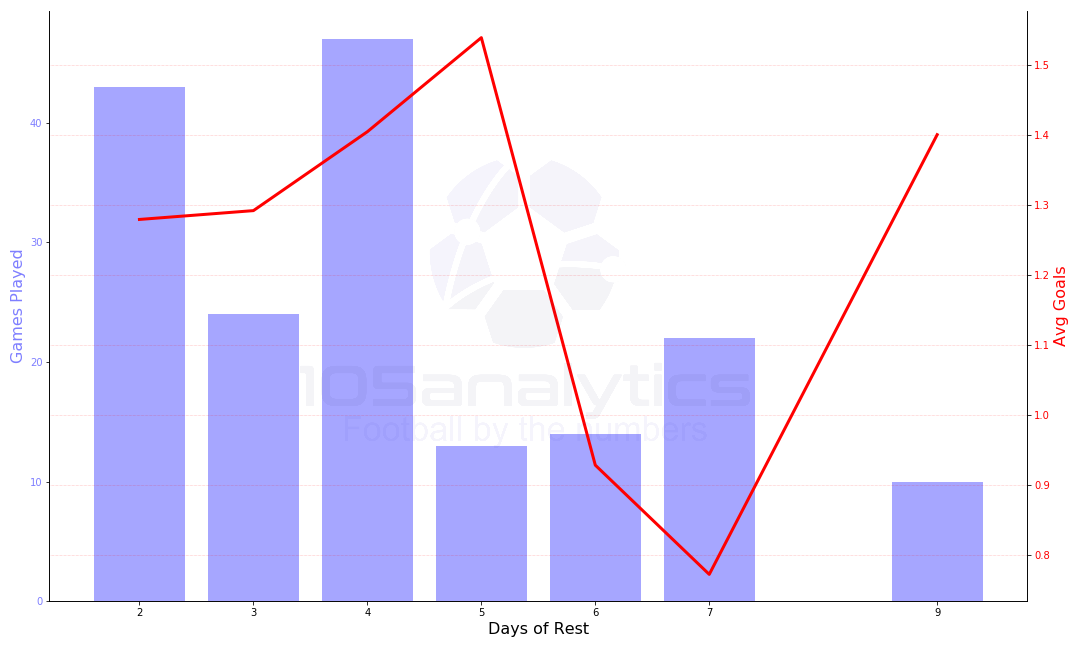
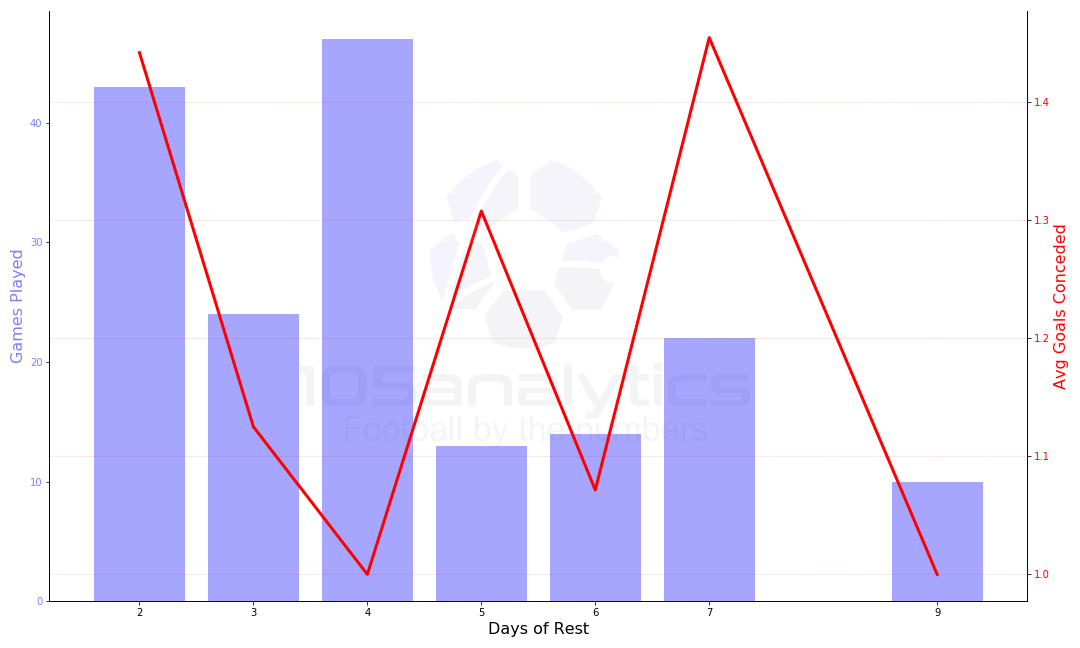
This just doesn't make sense. Or at least I initially struggled to rationalize what the charts were showing with my preconceived notions. The top goal scoring happened after 4, 5 and 9 days of test. And again, performance after 6 and 7 days of rest was abysmal while having only 2 or 3 days or rest didn't seem to have much of a negative impact.
The final attacking metric I looked at was the number of points a team acquired after a rest period. Every one of the games has two teams in it and the outcome of the game is what really matters. It's possible that a team on 2 days of rest is playing a team that just had 9 days of rest. So while the team on short rest might generate chances and put balls in the net, these might be wide open affairs and the opposition could have been winning more games.
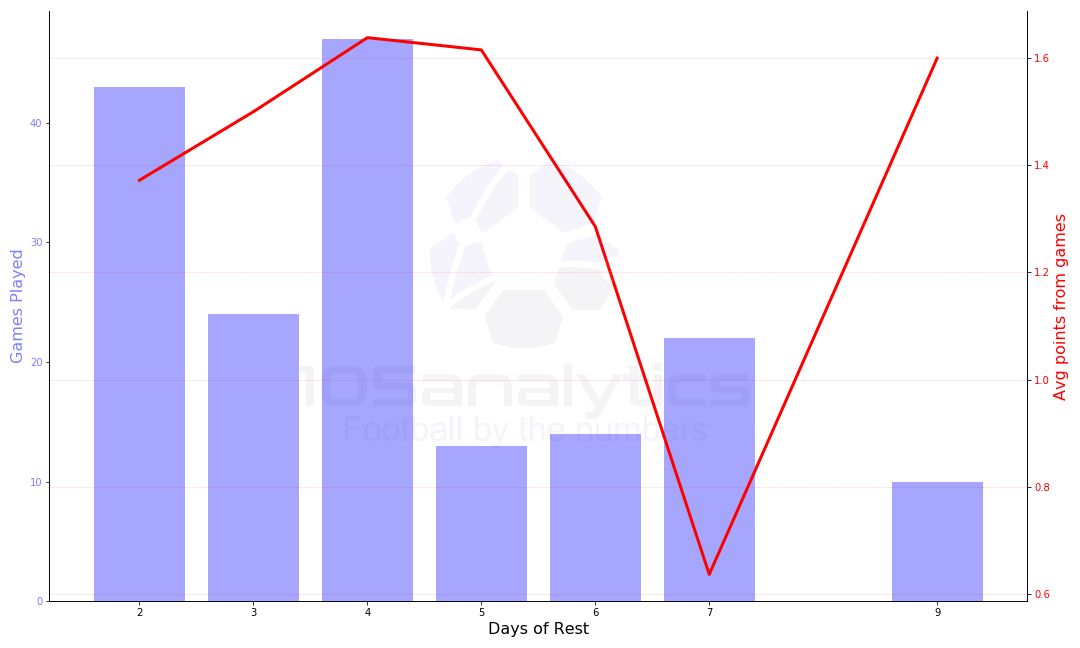
Like the other two attacking charts, teams on 4,5 and 9 days of rest picked up more points. But games after 2 and 3 days of rest performed really well too. In fact, the only rest period that generated lower than 1.2 points per game was 7 days. But, as you can see, the pattern of these three charts is very close to the same.
Hustling back
Defending takes a lot of energy. Energy that might be in short supply after trudging through a couple of airports, riding in cabs or a shuttle bus, and sleeping in hotel beds. I figured there might be some insight found in defensive metrics. The ones I chose are mostly inversely related to the metrics used in the attacking section above; expected goals against (xGA), goals conceded and expected goal difference (xGD).
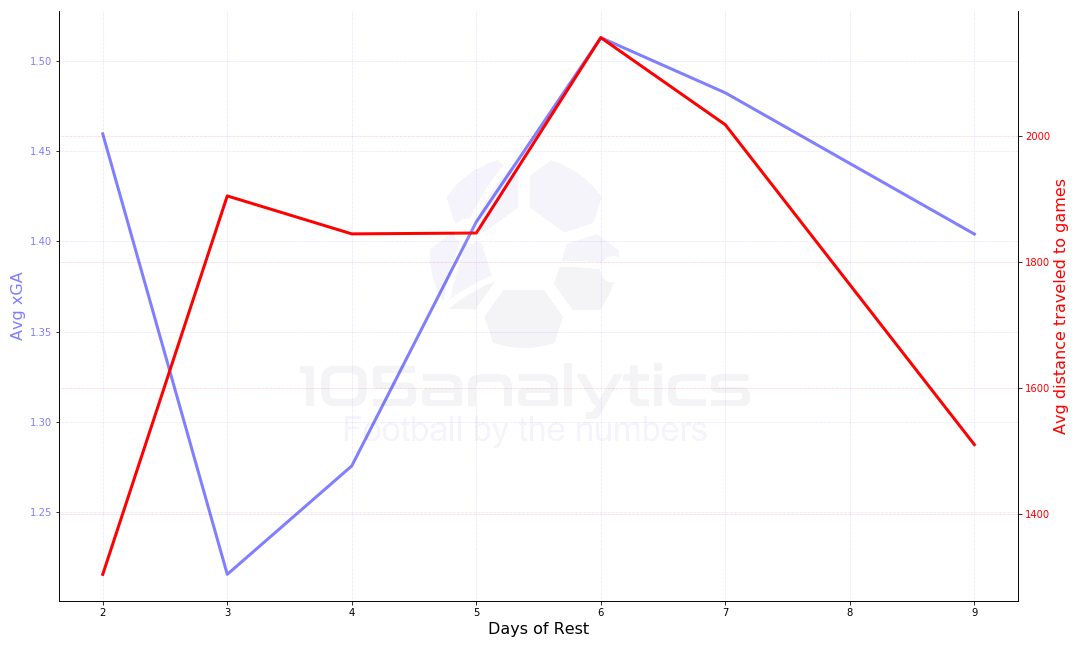
xGA measures the quality of the chances that a team gives up to its opponent during a match. A team's xGA value matches their opponents xG. Limiting an opponent's chances when playing tired can be hard to do and often you see team's defensive structure breakdown when fatigue sets in. They just "don't have the legs" anymore.
Like the xG chart, this one was unexpected. I fully expected to see teams giving up larger xGA numbers when on short rest, so the 2 day rest point seems normal. The 3 day of rest point is just odd. The second lowest number of days of rest has, on average, the best defensive performances? I would never have bet on that.
Again we see the opposite of what we'd expect for longer rest periods. Teams coming off of 6, 7 and 9 day breaks conceded a lot of chances. But did they leak goals?
Of course…hang on. A team on 9 days of rest leaked a lot of chances (1.4 xGA), but they didn't concede at the expected rate. That is the first time in these charts that the high rest periods performed how I thought they would. Games after 6 days of rest outperformed expectations as well. Those number for 7 days of rest though. Defenders and keepers should be nervous about 7 day breaks.
Teams playing on 2 days of rest conceded a lot of goals. We should expect this. Tired teams ship goals. The numbers drop quickly when you get one or two extra days of rest though.

To wrap up our view of rest's impact on defending, we can look to see how teams performed against their opponents. For this we use xGD (expected goal difference) which simply is xG - xGA. Any sub-zero xGD number means that a team's opponent created higher value chances in the game.
As we can see here, a team should have expected to under perform their opponent when they only had 2 days of rest. Like almost every other chart has shown, 6 and 7 days of rest are bad for team performance too. Really bad.
Maybe it's not time
So far the charts have looked at a time based measure of the schedule. It's a simple measure. How long does a player (and a team) have to recover to the point that they can perform at the same level. There is another thing that impacts the severity of the CPL schedule. Travel distance. HFX Wanderers vs Pacific FC is the third longest away game in the world of soccer. Anyone who has flown across Canada can attest, it is usually a very long day. While these are professional athletes, the league and clubs are (mostly) newly formed, so flying is an economy class experience. Easton Ongaro must have an extra joint in his legs to survive the flights.
How can the travel distance be interrogated to see if it has an impact on the on-field output of the teams. There are probably many ways to do this. I settled on blending the metrics showing in previous charts with average distance traveled for a given number of days of rest.
NOTE: Distance traveled was calculated like days of rest. It factors in non-league games and measures the distance traveled from one airport to another. If HFX Wanderers were to play a home game, then travel to Pacific FC, and return home for a third match, the Pacific FC game would have a distance traveled of 4465 km and the second home game would have a distance traveled of 4465 km. A Forge FC home game followed by an away game at York9 would give the second game a distance of 69.5 km. These measures are based on direct travel and don't take into consideration any distance added that flight connections might generate.
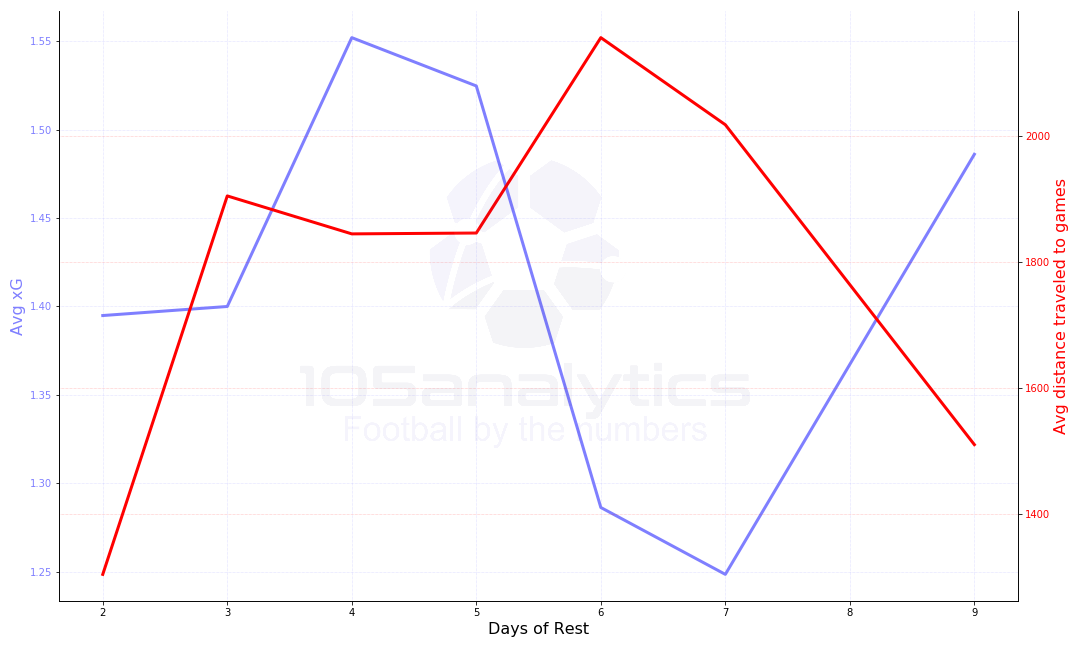
There's a lot to unwrap in this first chart. The red line shows the distance travelled based on the number of days of rest. We can see that after 6 days of rest, teams traveled an average of about 2200 km for their match. This is the highest travel burden shown in the chart. Seven days of rest has the second highest average travel distance. Those two numbers have been called out repeatedly my comments above. What the chart is showing is that while teams are getting a lot of rest leading up to those matches, they're traveling long distances and (in this case) it appears that their offensive output is at its worst.
It is also nice to see that while there were 43 games played on 2 days of rest, the travel burden for these games was the lowest of any grouping (1303 km). I'm a little shocked to see that teams did not having to travel far after a 9 day rest period though. I think an ideal world would have the red line going up as it moved from left to right in the chart.
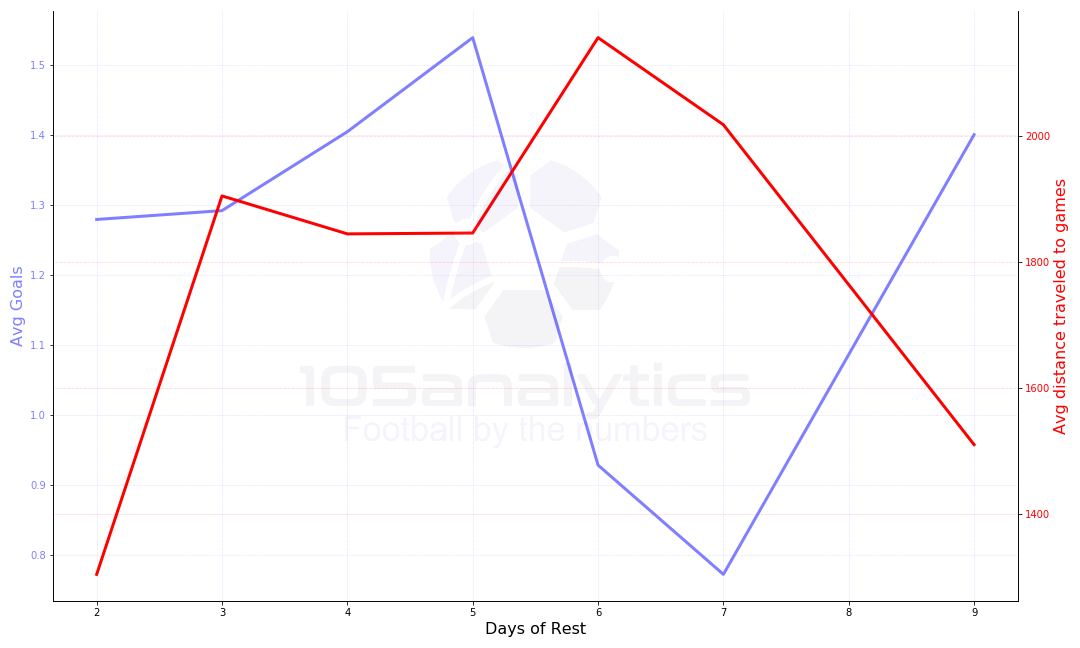
Looking at the number of goals scored shows similar information. Shorter travel distances appears to relate to better offensive output. There's probably a connection to the number of days of rest too. In this case travel is about the same for 3, 4, and 5 days of rest but the number of goals scored continues to climb as more rest is available. At 6 and 7 days of rest the amount of travel sharply increases and goals scored plummets.
Defensively, the connection between distance and xGA doesn't seem to be as strong. Goal scoring chances conceded don't seem to be connected directly to the shorter travel distances. There does appear, however, to be a strong connection between long travel distances and conceding more chances.
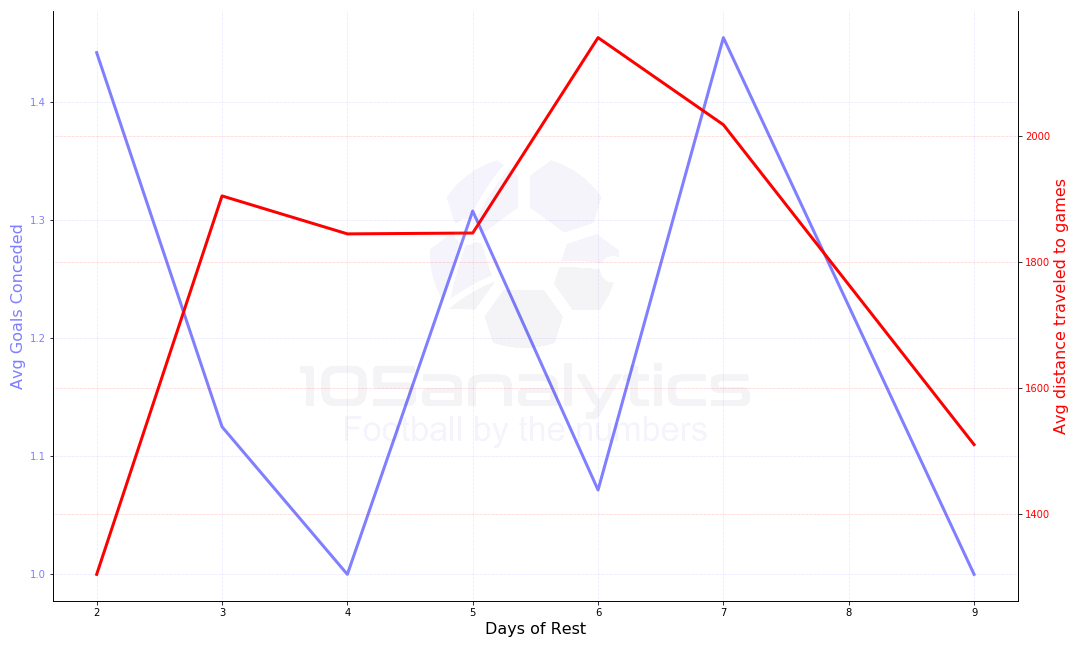
Unlike xGA, actual goals conceded is a mess. I’m not sure what to read into this one other than no pattern seems to exist.
Conclusion
I don't think there's a direct correlation between days of rest and on-field performance. There probably isn't a direct correlation between distance traveled and on-field performance either. It looks like both days of rest and distance travel have, as you'd likely expect, an impact on games.
I was surprised to see that the fewer days of rest didn't create obvious, glaring issues for teams. I was even more surprised to see that 6 and 7 day rest periods consistently had a negative impact on games. I'd have to dig deeper into this, but my working hypothesis is that a long rest period is followed by a long travel day. Looking at team and player Twitter and Instagram activity, travel seems to usually happen the day immediately prior to those games. So a player would rest for 6 days, get on a plane and travel a long distance filling most of the 7th day, and then play the day after the flights. Maybe these long distance trips are killing legs, energy or rest levels. It's an area I think the teams will want to investigate more. Maybe run some experiments in 2020 to see if they can improve those numbers.
There are a handful of other areas that warrant exploration too. How do teams play different later in games? Are players less active? Do they move more slowly? Are less chances generated and/or converted in the final 15 minutes of games played after short rest periods?
Unfortunately the CPL data dump doesn't include the types of data needed to dig into those questions. Some probably require player tracking data which is something I'm likely to never see for use on this blog. The data to answer the questions is probably available, someone else is going to have to look into it though.
Thanks to the CPL for making the data used in this analysis available.
Post script
I was getting ready to post this and decided it was best to sleep on it. I'm not exactly why I thought that, but it's what I did. Wouldn't you know it, I came up with some more thoughts on the topic.
The horrible form that teams showed after 6 and 7 days of rest really stuck with me. Why was this happening? My initial thoughts (see above) were that it was probably due to traveling the day prior to the matches, but I didn't back that premise up with any data driven insights. I realized that I could give that insight though. The data provided by the CPL and Opta allows me to look at the individual matches that happened after 6 or 7 days of rest. Here's what I came up with.
There are two reasons that a team will have travel before a match:
- they are returning home to play a game
- they are leaving home to play an away game
The impact of travel is different in each case. If a team is returning home to play the game, the travel they have to do is most likely to be done at the start of the rest period. An away game is played on Saturday, the first day of rest is used to travel home, 5 more days of rest and recovery occur while the team is at home, and finally a Saturday home game occurs. This is the optimal rest scenario. 5 full days of rest and practice (out of 6) with no travel requirements. The players will be as rested as possible given the length of the break.
If the team has a rest period followed by an away game it appears that they will travel the day prior to the match. In this scenario a home game is played on Saturday, 5 days of rest and recovery occur at home, followed by 1 day of the rest period which is used for traveling to the away match, and the following day is the away match. The players get the same amount of rest and recovery as if the match were at home, but it is interrupted by a day of travel immediately prior to the match.
The question I asked myself was "how many of the games played after 6 or 7 days of rest are away games and did the performance numbers differ significantly for those games?" First, there were 36 games played after 6 or 7 days of rest. Of those, 21 (58%) were away games. That's a significant amount of the games in this category.
For those 21 away games, the average travel distance was 2552 km. To put that in perspective, the highest average travel distance for any other rest period was 1905 km (games played after 3 days of rest). This is a remarkably high number.
Looking at the home and away match data averages for games played after 6 or 7 days of rest presents the following:
| Home | Away | |
|---|---|---|
| Distance traveled | 1400 km | 2552 km |
| xG | 1.45 | 1.12 |
| Goals scored per match | 1.07 | 0.67 |
| xGA | 1.55 | 1.45 |
| Goals conceded per match | 1.40 | 1.24 |
| Points achieved | 0.93 | 0.86 |
Generally, those are worse numbers on the road. Interestingly the teams did perform marginally better defensively in the away games.
Now I'm wondering if this is a problem regardless of the number of days of rest before a match. Tweak the code a bit and here's what comes up:
| Home | Away | |
|---|---|---|
| Distance traveled | 1251 km | 2116 km |
| xG | 1.56 | 1.55 |
| Goals scored per match | 1.37 | 1.13 |
| xGA | 1.32 | 0.83 |
| Goals conceded per match | 1.14 | 1.39 |
| Points achieved | 1.62 | 1.10 |
If a team had to travel to an away game, they went farther than if they were returning home to play their next match. Significantly farther. Somehow the way the schedule was created travel favours returning home instead of heading out to away games. Given how teams are more likely to travel to away games immediately prior to playing them, I would think that the distances traveled would be better reversed.
I think the league needs to consider this type of information when drawing up the schedule. It won't be as important once the league has an even number of teams and a more balanced schedule, but for now it seems to be making a difference. Regardless, if I were a team planning my travel, I'd be looking at testing to see if better outcomes are possible through earlier travel for away games. Yes, hotel and food costs will go up. The team might have to rent a training facility for a day or two. But could that lead to better road records?
Something to sleep on.