Set Pieces
When I first started this stats thing, the first set of data I investigated was around set pieces. I was curious to see how efficient the teams were both attacking and defending. Was the CPL different from other leagues around the world? Were some teams clearly better than others? Did the top teams in the league convert and/or defend better than the worst teams?
I've re-written and re-ran the analysis now that we're close to the end of the season. Here's what I found.
Set piece conversions
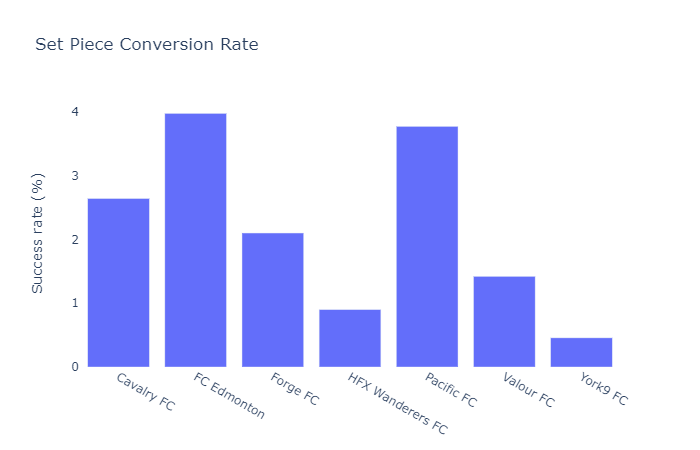
Probably the easiest data to consider is the rate a team converts set piece plays into goals.

As we can see from that chart, Forge and Cavalry (the two teams heading to the 2019 final) aren't the best teams in the league at converting set pieces. They are in the top half of the league at converting set pieces though, so maybe there's something there.
It's hard to find good comparative, summarized data, but these conversion rates seem to be in the rough range you'd expect from most leagues.
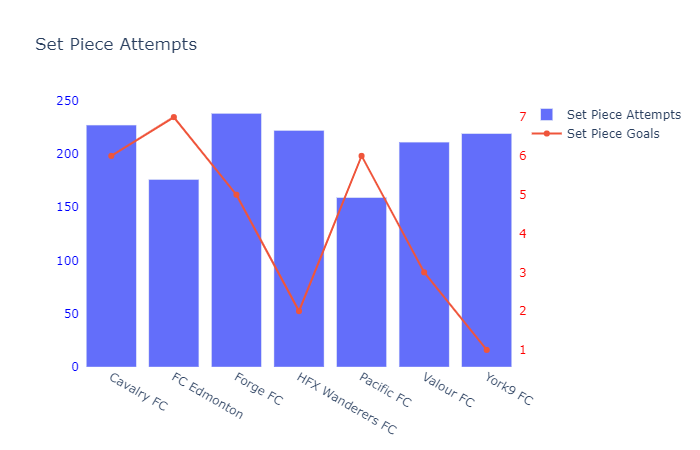
Another angle I wanted to see the data from was goals scored vs set piece attempts.

Like the first chart, there doesn't seem to be any connection between goals and attempts. The teams that take the most set piece attempts don't consistently score more goals from them. In fact, the one thing that stands out on this chart is that the two teams (Pacific and FC Edmonton) with the lowest number of set piece attempts are in the top half of the league scoring goals from set pieces.
Once again, we aren't able to say that strong set piece conversion is a definitive trait of the top two teams in the league.
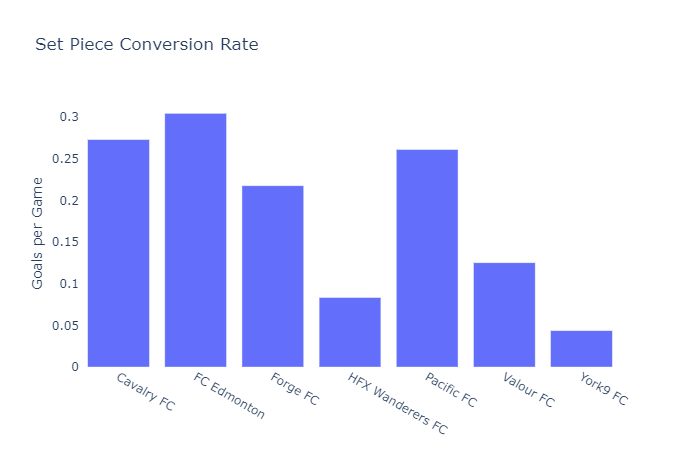
Ted Knutson wrote a great article about set piece efficiency and what it can (and should) mean to teams. One of the stats he uses to compare teams in that article is the number of set piece goals scored per game. According to him:
…most clubs average around 0.3 goals a game off set pieces
He also suggests that:
Elite clubs can push this number up to 0.75 or 0.80 goals from set pieces alone.

Looking at the CPL, only one team (FC Edmonton) rises to the Knutson's definition of "most clubs". That is somewhat dismal and certainly offers room for improvement in the coming years.
The other side of the coin
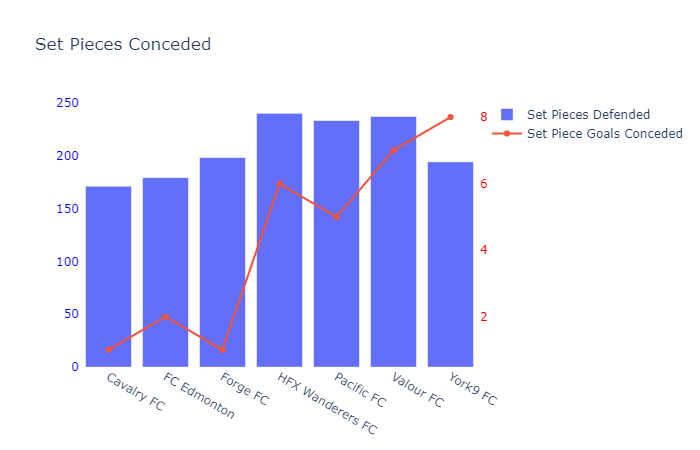
On set pieces there are two teams involved. One is always defending, and keepin the ball out of the net also contributes to the success of the team.

This chart, more than the first two, shows some connection between set pieces conceded and goals conceded from them. The more free kicks and corners you give up, the more goals you will have scored on you from them. Also telling is that both Cavalry and Forge are conceding very few attempts and both have only conceded 1 goal from those attempts this year.
I think we can say that strong set piece defending can help you to the top of the table.
Conclusion
I think the CanPL is ripe for a team to exploit with well worked set pieces. Teams, as we see in the last chart, are bleeding goals.
The problem the teams face is that the schedule is so congested that coaching staff needs to decide what to spend their precious practice time on. Unlike the teams in Knutson's article, it is rare for a CanPL team to get a week to prepare for an opponent. Spending 5-15 minutes "per week" (which I read as "per game played") likely represents 5-15 minutes out of 10+ hours of practice time. If you were HFX this past summer you might have been lucky to get 1 to 2 hours of practice and game prep. I suspect that there was little work on set pieces during that period, and it probably happened to every team at some point during the season.
With a less congested schedule we will likely see higher conversion rates across the league. When we see a schedule like that is anyone's guess, but I suspect it will be coming in the next couple of years.