Pasquotti's Long Throw-Ins
Early in the 2019 season Nico Pasquotti demonstrated his long throw-in skills and Cavalry showed that it was going to be a big part of their game. Whenever he felt like he was able to get the throw-in into the 18 yard box, Pasquotti was going to be taking the throw.
OneSoccer announcers started calling Pasquotti's long throw a "weapon" and built hype and excitement every time it looked like it was going to be used. It was asked about during half-time and post game interviews. Pundits and online conversations became enthralled by it. But was it effective?
Measurements
This was one of the earliest questions that I asked myself when I started looking at event data. But how do you measure the effectiveness of a throw-in? What even constitutes a long throw?
Determining what constitutes a long throw is an important boundary to establish. Do we care about throws that happen in the defensive half of the pitch? What about throws that are 15 meters long? Or 20 meters? For the purpose of this analysis I decided to constrain the definition to include only those throw-ins that resulted in the next touch being in the offensive 18 yard box. The length of the throw qualifying would vary depending on pitch size, but the end result was the same; the ball entered an area perceived to be high value.
Knowing what a long throw-in was, how did I want to establish the value derived from it? In it's simplest form, you could measure the percentage of times that a team retained possession after the throw-in.
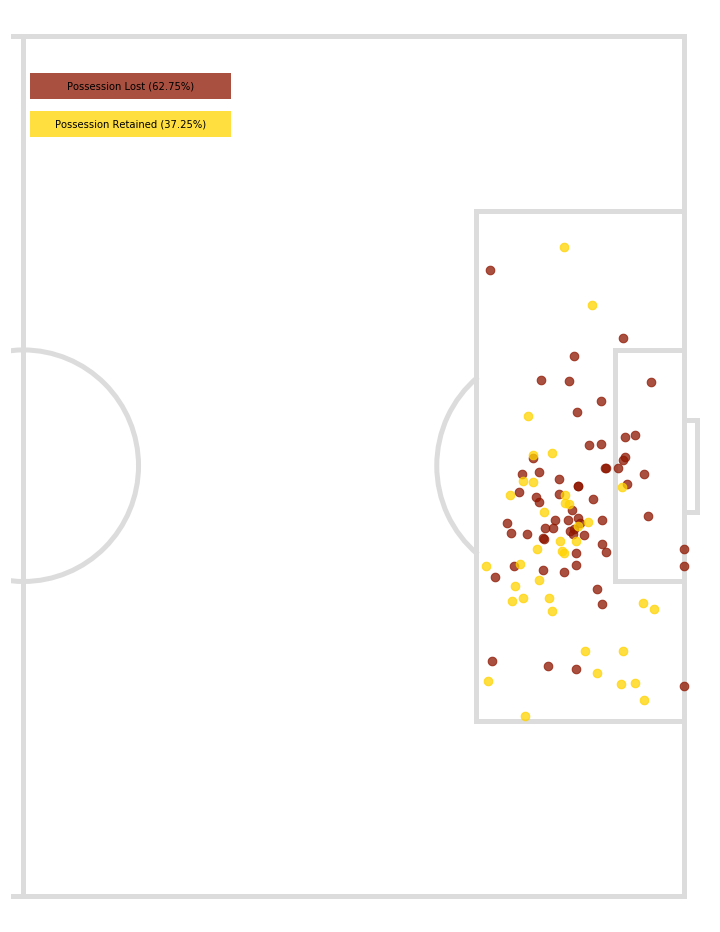
Only 37% of the time was Cavalry able to retain possession off these long throws. That doesn't seem very effective. Pasquotti was giving his team possession of the ball in the 18 yard box a bunch of times though. Thirty-eight times this happened in 2019.
Is percentage of possession retained a deep enough metric though? What did the team do with that possession? Was it a flick on header that trickled out of bounds on the other side of the pitch? Did they get a shot off? Was it a bad first touch and the defending team immediately cleared the ball? All of those situations provide a different amount of value to Cavalry.
It's hard to look at every possible outcome from retaining possession. A total sample size of 38 will get split up into many buckets each providing too small of a group to really determine anything from. A simple split based on the possession resulting in a shot or no shot might be enough to get some more meaning.
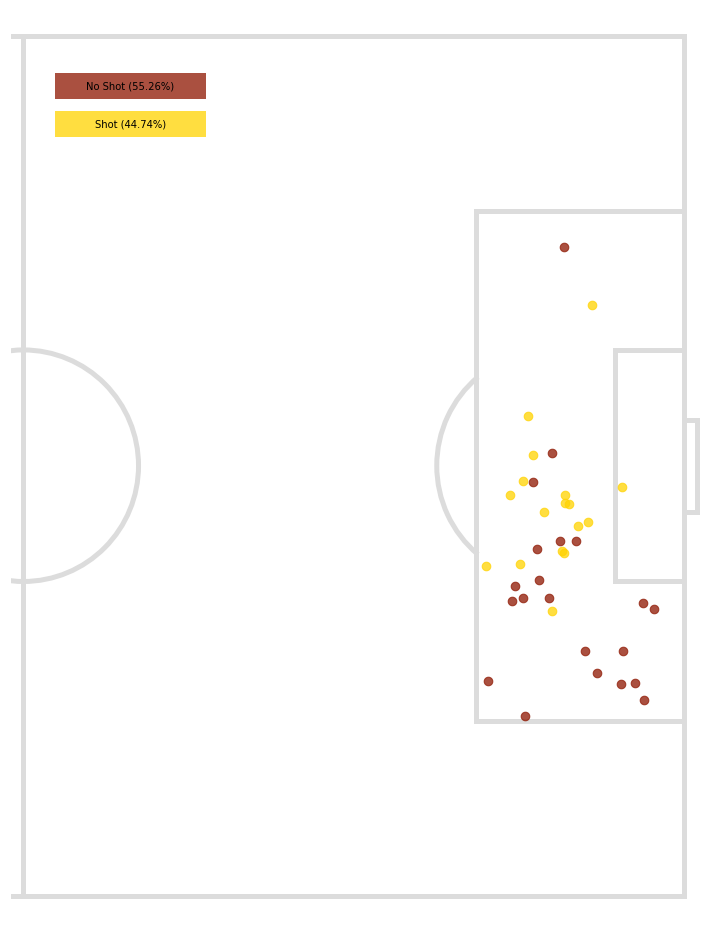
Looks like Cavalry were able to get shots off for about 45% of the throw-ins that they retained possession. In raw numbers, that's 17 shots for the entire 2019 season, or about 16.6% of Pasquotti's long throw-ins.
We can go one step farther with the shots that were taken and look at the expected goals (xG) value for them. That can be used to determine what scoring value the shots have.
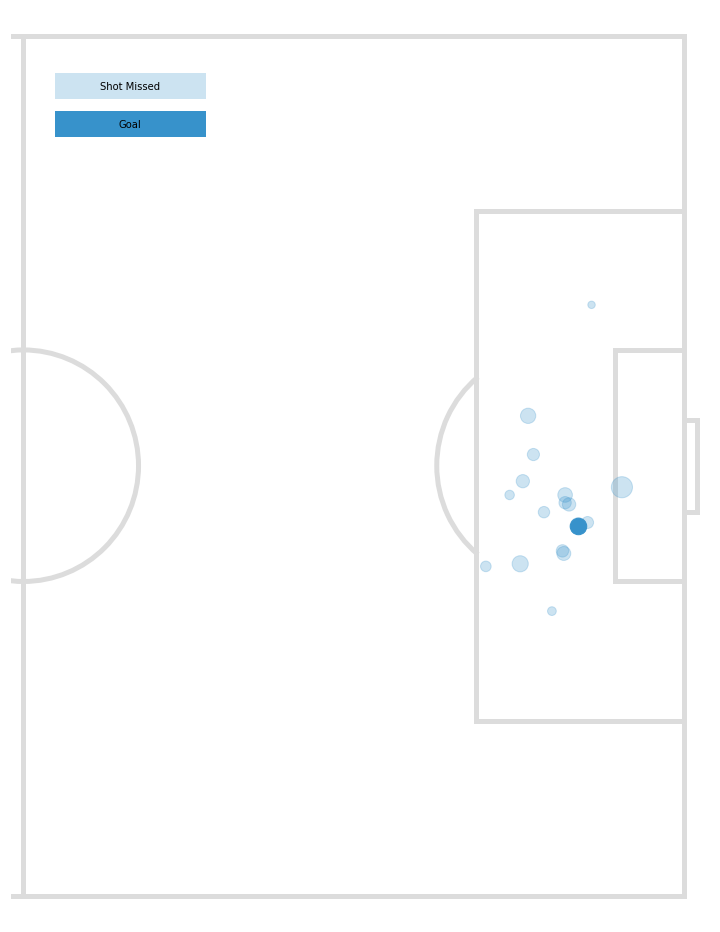
NOTE: Before getting too far into this image, I should make it clear that these dots do not represent the location where the shots were taken from. The dots are on the locations where the first touch after the long throw-in was made. It allows us to see what the xG value of the possession is based on the location that the throw-in was made to.
The most visible thing that this shot map shows is that there was only 1 goal scored out of the 17 shots taken. That's not the greatest conversion rate given that a very, very rough estimate for leagues around the world is 1 goal from every 10 shots. Using that extremely rough estimation, shots taken from Pasquotti's long throws were about half as likely to convert to goals as should have been expected.
It's also possible to infer the xG value for each shot by looking at the size of the dots used. For example, the shot taken from the possession starting at the top of the six yard box had the largest xG value. The possession that led to the goal had a shot with a fairly high xG value as well. There are also a bunch of shots with much lower xG values. Not all shots are created equal so this is perfectly fine to see.
If the xG for all 17 shots is summed up, a total of 2.028. The xG model expected Cavalry to score just barely more than 2 goals from these shots. This is actually a slightly worse conversion rate than the extremely rough estimation method outlined earlier.
Conclusion
There were 102 Pasquotti long throw-ins that ended up in the eighteen yard box. Those throw-ins resulted in a total xG of 2.028. We can take this to mean that each Pasquotti long throw-in had an xG value of 0.0199. Another way of reading that number is that a Pasquotti long throw-in had about a 2% chance of resulting in a goal.
So we've measured the value of a Pasquotti long throw-in fairly accurately. But is that value good or bad for Cavalry?
My analysis is going to stop here for now, but I could take it further by:
- looking at the conversion rate and xG of all throw-ins that happen in the attacking third (or some such area of the pitch) and compare Cavalry's results to that
- looking at the conversion rate and xG of open play entries into the 18 yard box and compare
There are probably more ways to dissect this frog. For now, I think it's safe to say that the value obtained from Pasquotti's long throw-ins is minimal. The one goal that was scored came very early in the season when teams were still struggling with their defensive systems. Would I pay attention to it as a defensive coach? Absolutely. But I wouldn't fear it.